Walmart Supplier Toolkit · Water

How much water does it take to produce a single unit?
The Water Use Efficiency Index turns that question into one number you can compare. Enter your water withdrawal and your production for the same period, and see where you sit: a single site measured against Best-in-Class Location, or your whole enterprise measured against Best-in-Class Enterprise.
Total volume of freshwater withdrawal for on-site production activities per unit of production output. Units of measure are unique and relevant to each segment.
Step 1 Your segment
Which of these describes your facility?
US average, covering water supplied and wastewater treated. Change it if you know your own rate.
Used for the energy and emissions savings. Defaults are the US average, or the rates for the state you select.
Step 2 Enter your usage
Your numbers
(use same time period for water withdrawal and production below – 12 month time period suggested)
Select scope of water and production volume
Direction for Entering Your Inputs
- Select the scope for your analysis. Are you considering the water withdrawal and production volume across one individual site, or does the analysis consider total water withdrawal and production across all facilities of a certain type within your enterprise?
- If an individual site is selected, choose the state where the facility is located. This will improve the accuracy of the default utility values used in the analysis.
- Add up every freshwater source you withdrew from over a consistent time period (12-month period suggested): municipal supply, groundwater wells, surface water. Use meter readings or utility invoices instead of estimates for better accuracy.
- Sum your total production output over the same period (12-month period suggested), in the unit shown above. Be careful to use the same time period. For instance, do not mix a year of water withdrawal with a month of production.
- Do not net out discharge or reuse. The score measures what you withdrew, not what you consumed.
- Convert first if your internal units differ. Mismatched units are the most common cause of a misleading result.
- Please enter your utility costs. Default values for the selected state, or U.S. averages where state-specific values are unavailable, will be used unless overridden.
Your result
Your plant against the benchmark bands
| Band | Value |
|---|---|
| Best-in-Class (Location) | |
| Best-in-Class (Enterprise) | |
| Sector Range, above this is laggard | |
| Your plant |
Opportunity savings
m³
Water
therms
Thermal energy
kWh
Electrical energy
t CO₂e
GHG
Cost savings
Now what · your plant
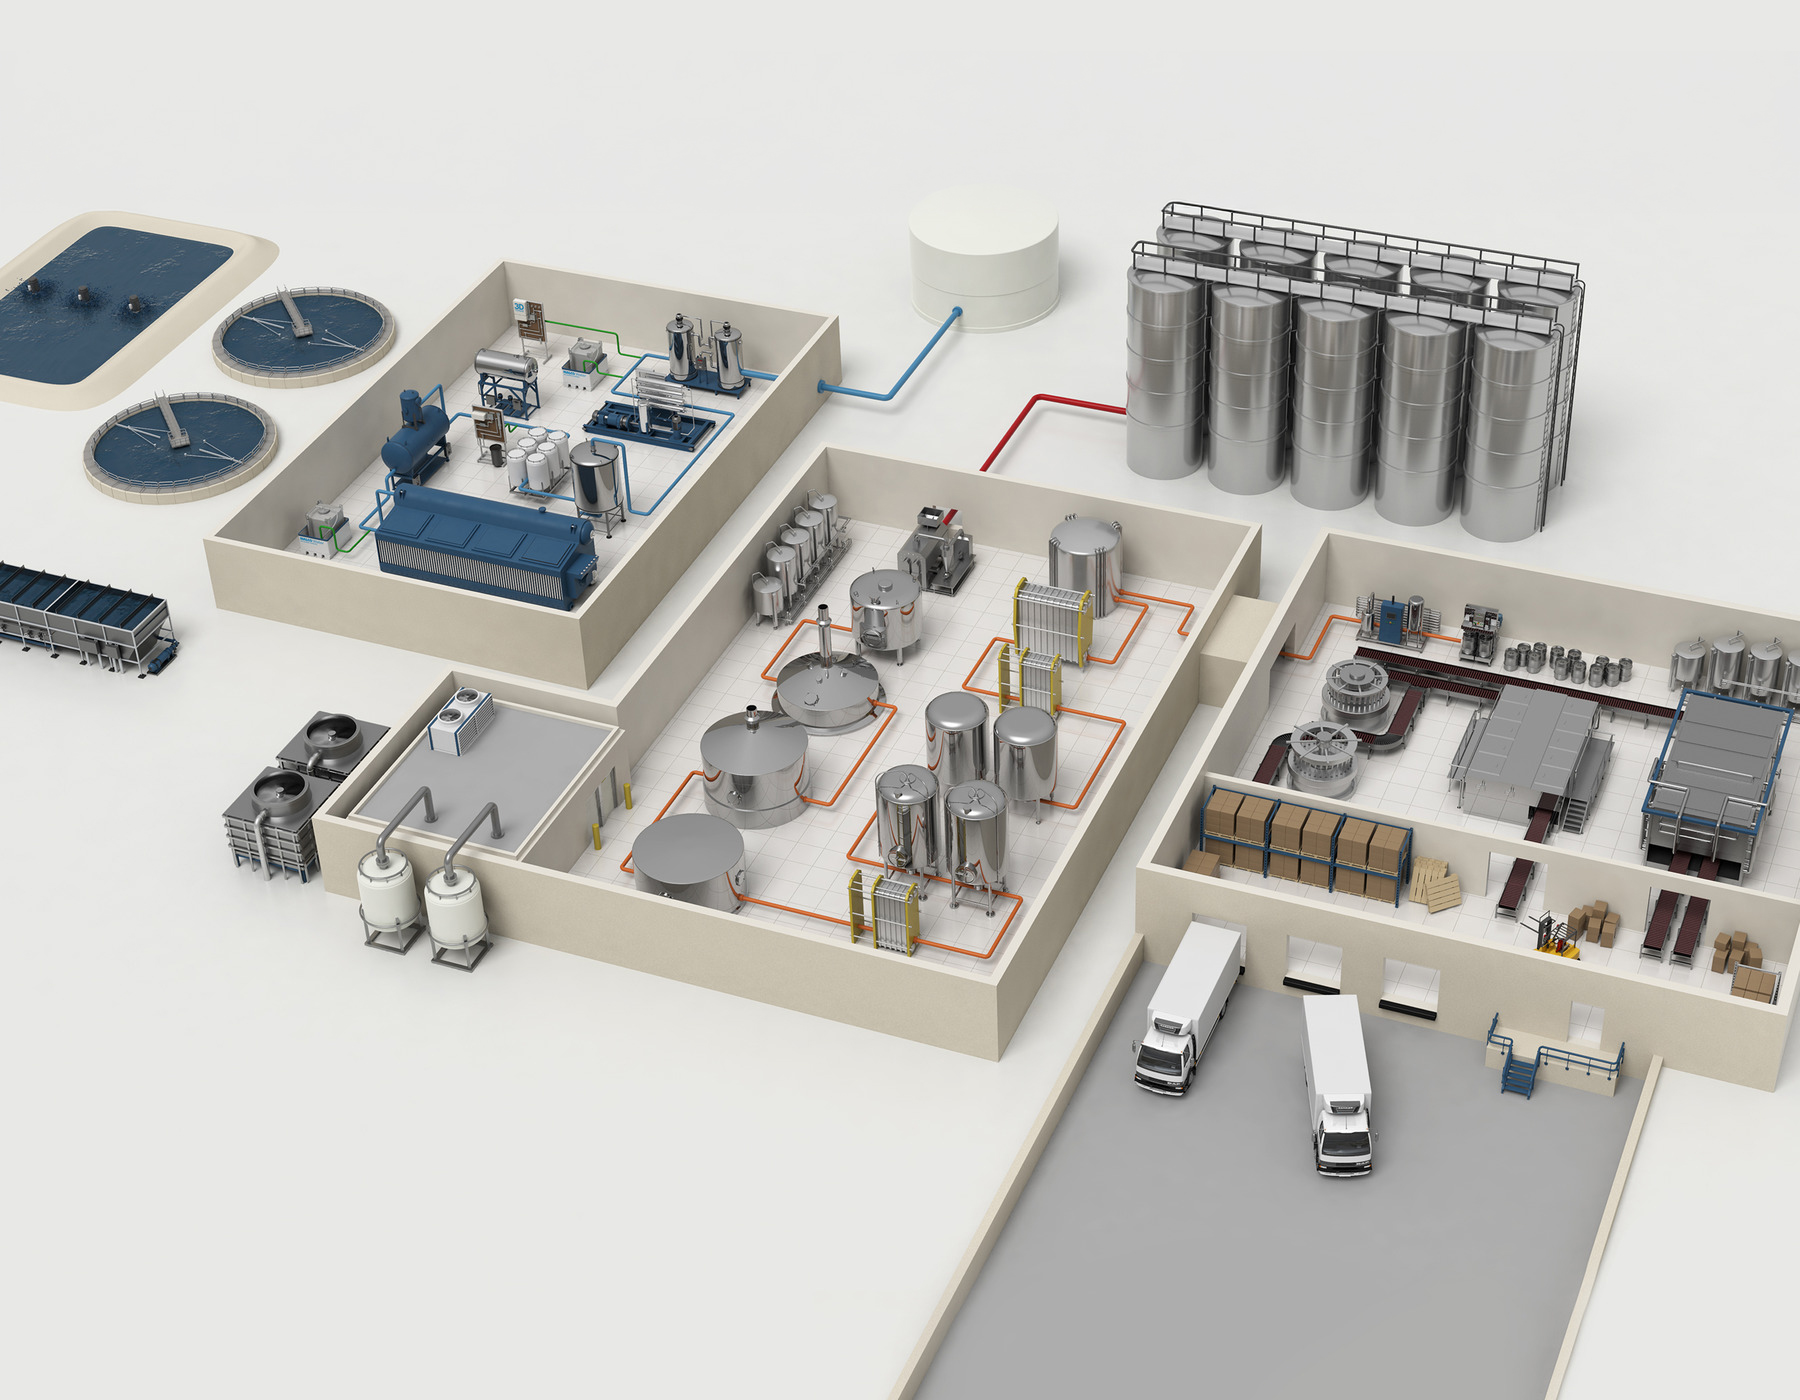
Where that water is going.

Point at a number on the plant for a preview. Click any number or area to open it.
Tap an area to open it.
Areas in this plant
Take it further
Want a closer look at any of these?
What you entered
- Segment
- —
- Measured as
- —
- Your Water Use Efficiency score
- —
- Status
- —
- Gap to best-in-class
- —
Opportunity savings
m³
Water
therms
Thermal energy
kWh
Electrical energy
t CO₂e
GHG
Cost savings
Tell us which areas you want to dig into and someone who works on these plants every day will follow up. No commitment, no pitch deck.